AMD APU: How Much Progress Has Been Made?
Power Consumption and Temperatures
Power Consumption
To measure power consumption we use a killawatt meter and measure the total system power draw at the wall. We run three different scenarios for 5 minutes and take the average reading, these are Windows desktop idle, AIDA64’s system stability test and Prime95’s blend test.

Power consumption is where AMD’s APUs have improved the most, we see an overall decline in power consumption since Llano but with a doubling of GPU performance and a 10%~ overall boost in real world CPU performance.
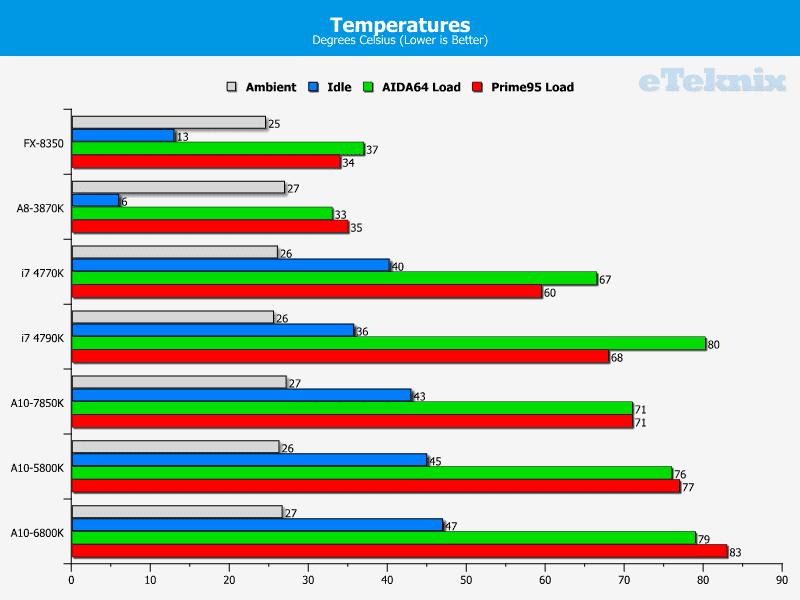
Temperatures
To measure temperatures we run three different scenarios for 5 minutes: Windows desktop idle, AIDA64 Engineer system stability test and Prime95 Blend system load. We take the average maximum core temperature for AIDA64 and Prime95 and take the average minimum core temperature for desktop idle.

The temperature sensors on AMD’s A8-3870K (and FX 8350) aren’t really showing anything that accurate so we can’t draw too much from those results. However, comparing Kaveri to the A10-5800K and A10-6800K (all of which use the same temperature sensor design) shows a decline in load temperatures, this comes from the increasing power efficiency of Kaveri’s Steamroller versus the Bulldozer & Piledriver of its predecessors.


For laptops which are often used without connection to a power supply, I think the iGPU will be great if you need it often (and a better solution for a long lasting battery than a discrete GPU and also for the life of the system by having less heat output). For browsing/office tasks though, the strong Intel CPU’s (i5 and i7) might have the edge since they’ll soundly win the race to idle.
I’d probably prefer the Core i7 with Iris Pro there, despite the much higher price 🙂
This review would be a bit more believable if a current low end i5 was added. But that would hurt Intel’s performance.
So many reviewers are afraid to upset Intel and would rather give the internet public half the story instead.
1) It isn’t a review. 2) We have no issues with upsetting Intel or any other hardware vendor if that’s what the results of objective testing cause. 3) It isn’t possible to test everything, this is about the progression of the APU, the other processors are just in there for a bit of background and relativity. This is not an Intel vs AMD article but great job for trying to make it one.
You say: ‘It isn’t possible to test everything.’ Yes that’s true, but not only have you not included a low end i5 but you haven’t included any i5’s at all. It sound’s like you went to a lot of trouble to find an i5. The biggest loser here is credibility (Intel say’s thankyou once again) of this review and the consumer.
Not at all. If i remove the Intel results from the review it doesn’t add anything. I don’t think any credibility is lost here, especially as I’ve said numerous times we’re not comparing the APUs to the i7, they are just extra results we had that provide interesting context. Of course you’re entitled to your opinion so if you feel this review has no credibility then you’re welcome to that opinion. Should I manage to come across an i5 I may update the graphs at a later date.
Sad to see no worthy improvements on the CPU side of things reason why no one is taking their APU’s seriously its almost just a gimmick to hide their god awful CPU performance that is still around a Llano CPU. At least their GPU was improved doesn’t seem like Amd learned their lessons either since next design is rumored to also have many cores and that probably means low single threaded performance yet again.
The best thing at Amd is hope i guess with Jim keller and their wins on the consoles as well as moving into the Arm market for servers.
Also to be fair this review should of used 2133 ram on the APU’s that supported it.