ASUS STRIX GeForce GTX 970 4GB Graphics Card Review
Ryan Martin / 10 years ago
Test Systems and Procedures
Before we delve into any testing we would like to take this opportunity to overview our test system and thank those sponsors who kindly provided us with test equipment to make our work possible. We offer our thanks to:
Intel for supplying us with a Core i7 4960X processor, which we reviewed here.
ASUS for supplying us with a Rampage IV Extreme motherboard, which we reviewed here.
Be Quiet for supplying us with a Power Zone 1000W modular power supply.
Kingston for supplying us with a Hyper X 240GB SSD, which we reviewed here.
AMD for supplying us with a Dell U2711 Ultra Sharp monitor.
Corsair for supplying us with a Hydro Series H100i liquid CPU cooler, which we reviewed here, and the Corsair Vengeance Pro Series 1866MHz 16GB memory kit, which we reviewed here.
Lian Li for supplying us with a PC-T60A test bench.
Noctua for supplying us with NT-H1 thermal compound.
Test System
- Motherboard – ASUS Rampage IV Extreme X79 LGA 2011 Motherboard
- Processor – Intel Core i7 4960X at Stock 3.6GHz with Turbo Mode disabled
- RAM – 16GB (2 X 8GB) Corsair Vengeance Pro Series 1866MHz at 9-10-9-27
- CPU Cooler – Corsair H100i with Quiet Fan Profile with Noctua NT-H1 Thermal Compound
- Power Supply – Be Quiet Power Zone 1000W
- Main Storage Drive – Kingston HyperX 240GB SSD
- Chassis – Lian Li T60 Test Bench
- Displays – Dell U2711 Ultra Sharp
- Operating System – Windows 7 Ultimate 64 Bit
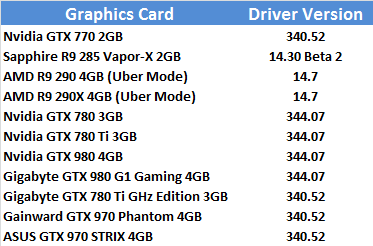
Driver Details

Performance Summary
To formulate our performance metric we use a weighted average method and each benchmark test gets a weight of 1 out of a total calculation with 9 weights (meaning all resolutions and variations of the same test are only ever one weight). Compute tests, power consumption, temperatures and acoustics are not included in the weighted calculation. The 9 weights are 1 for each test we so that means 6 games (listed below) and 3 benchmarks (also listed below). We calculate the relative score for each card in each test by dividing the cumulative average frame rate or score of each card by the average cumulative average frame rate/score from all the graphics cards in group. We then take those 9 relative scores and average those for each card, before dividing those averages by the average of the card being reviewed in the test so that the value of the card being reviewed is 1 and every other card’s performance metric is in relation to it. The end result are numbers that vary around 1 with 0.5 being half the performance of the tested card and 2 being double the performance of the tested card. We then convert those numbers into percentages to make them more readable so 1 becomes 100% and 0.5 becomes 50%.
Hardware Used
- “Killawatt” style electricity usage meter wall plug
- Benetech GM1351 decibel meter
Games Used
- Batman Arkham Origins
- Battlefield 4
- Bioshock Infinite
- Hitman Absolution
- Metro Last Light
- Tomb Raider
Benchmarks Used
- 3DMark
- 3DMark 11
- Unigine Valley
Other Software Used
- Unigine Heaven
- Furmark
- CPU-ID HWMonitor
- TechPowerUp GPU-Z
- Computemark
- Luxmark


