Drobo 5c 5-Bay USB Type-C Self-Managing DAS Review
Bohs Hansen / 8 years ago
Software
The Drobo Dashboard is the software piece that will help you initialize, update, and manage your Drobo systems. Whether they are network connected like the Drobo 5N we reviewed a little while ago or direct attached like the Drobo 5c that we’re testing today, the software will find them all.
The software will automatically detect whether there are updates available, both for the software and for the physical unit. Having the latest software and firmware is a great idea as it will include bug fixes and new features.
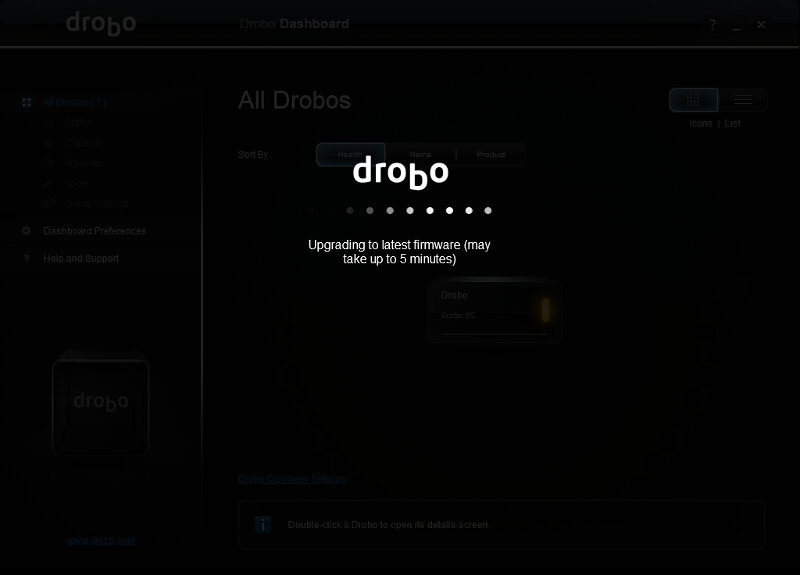
Once your unit has updated, it’s time to create a drive volume on the unit. If we had moved our drives from another Drobo unit, we’d be ready to go already. But we didn’t, so we need to format our drives.
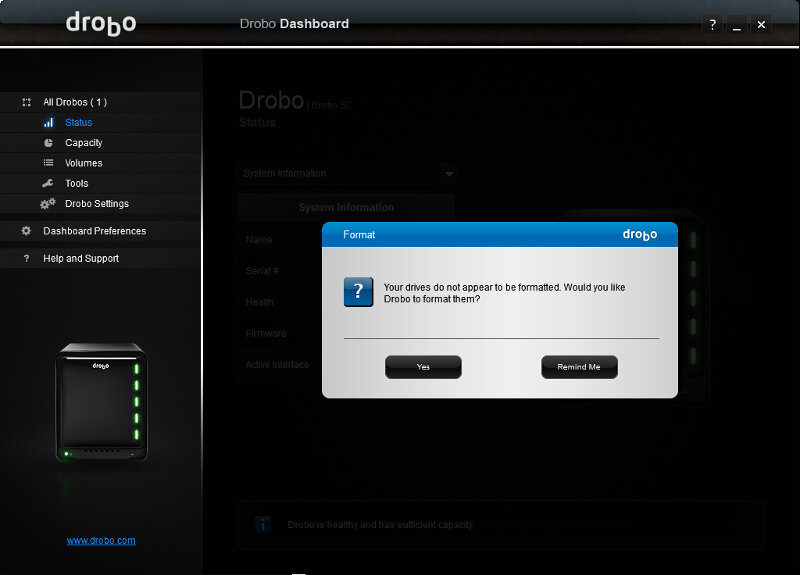
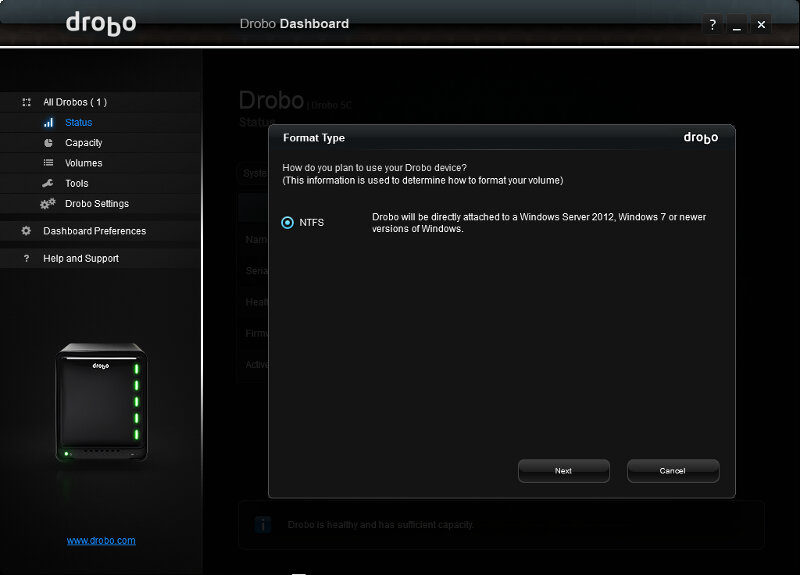
Since we’re connecting from and using it with Windows, we’ll format the Drobo 5c as NTFS. It also supports HFS+ for Mac OS users.
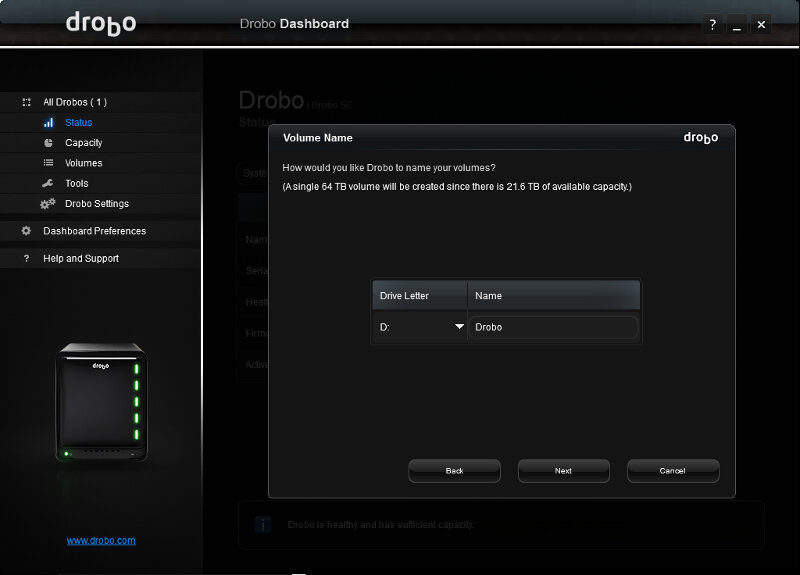
Assign a drive letter and volume name, and that’s it.
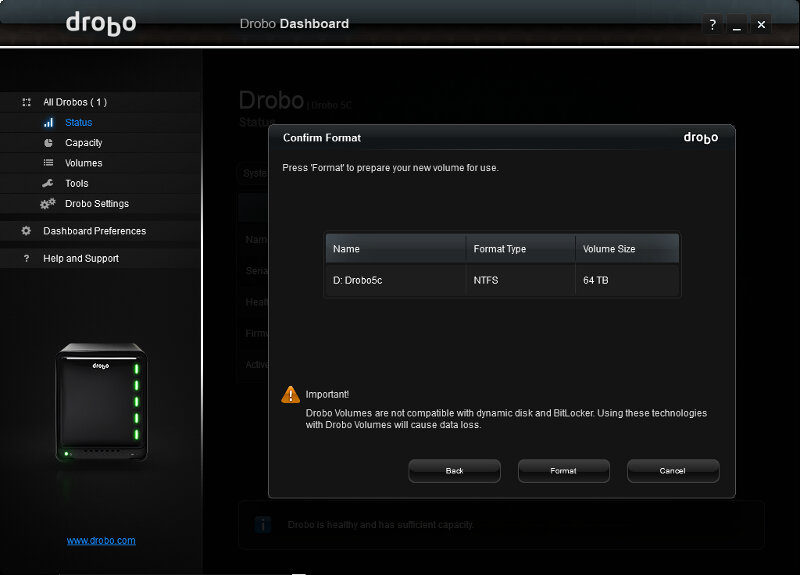
We get a final look at our settings before any action is taken. Hit the format button and we can move on.
The progress can be monitored through the status window where we can see that it is being initialized. There’s also a popup from the tray icon informing of on the actions.
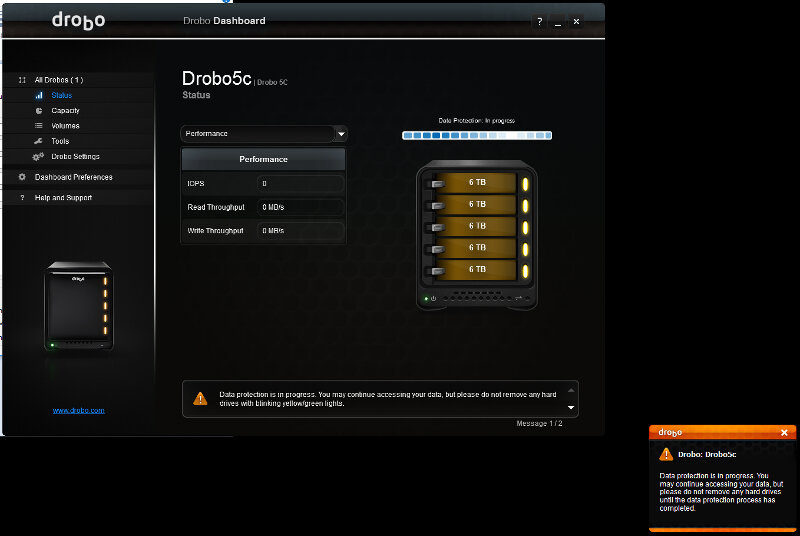
Now that the Drobo 5c has been initialised, we can have a look at the Drobo Dashboard and its available features and functions.
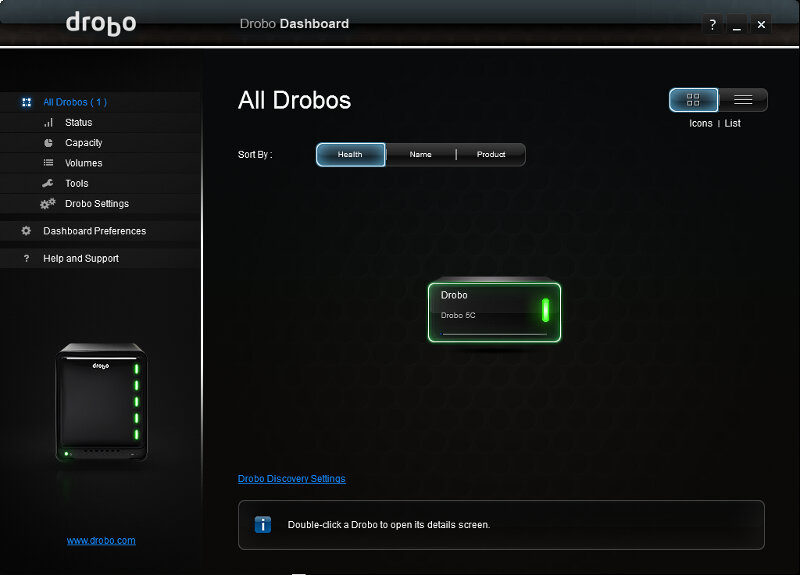
The first page within the Dashboard lists all detectable Drobo devices, both local and network attached. You can sort them by their health status, name, and device type.
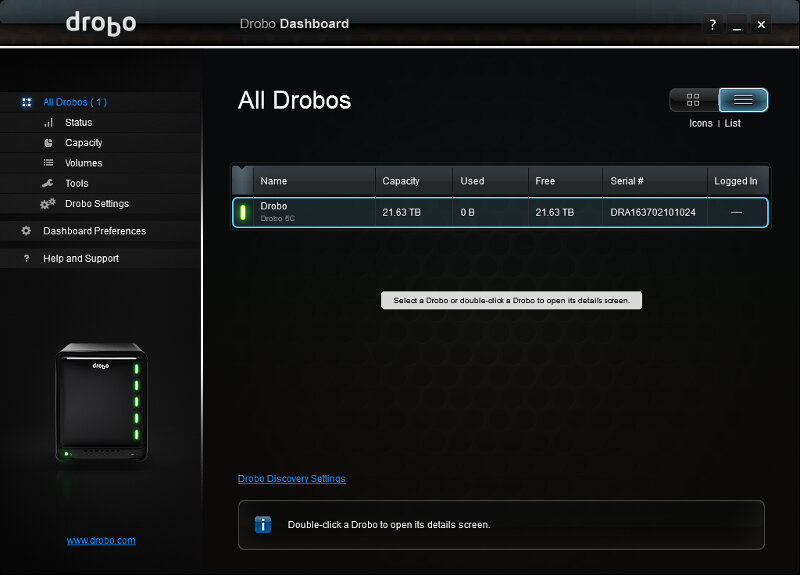
There is also an alternate list view instead of the icons, and the list shows some more details on each device.
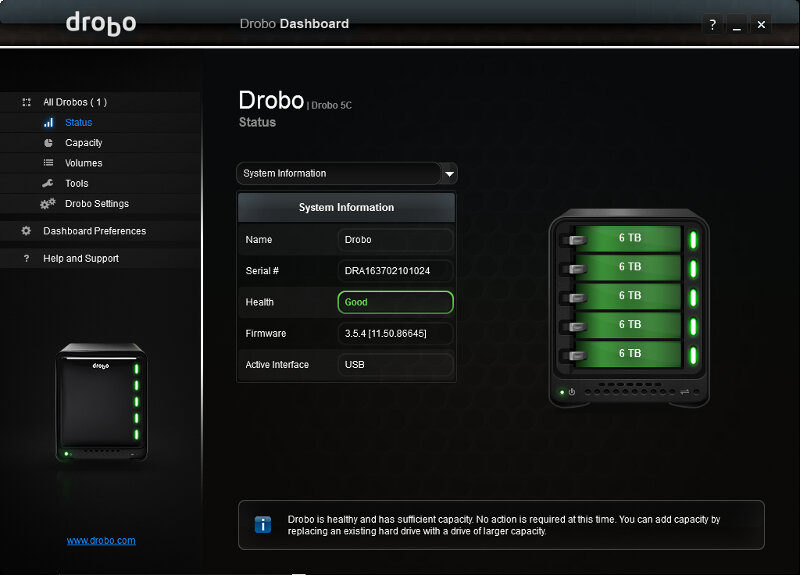
Doule clicking a device will take you to its details, starting with the System Information. This page contains the device’s name, serial, health, firmware, and connection interface.
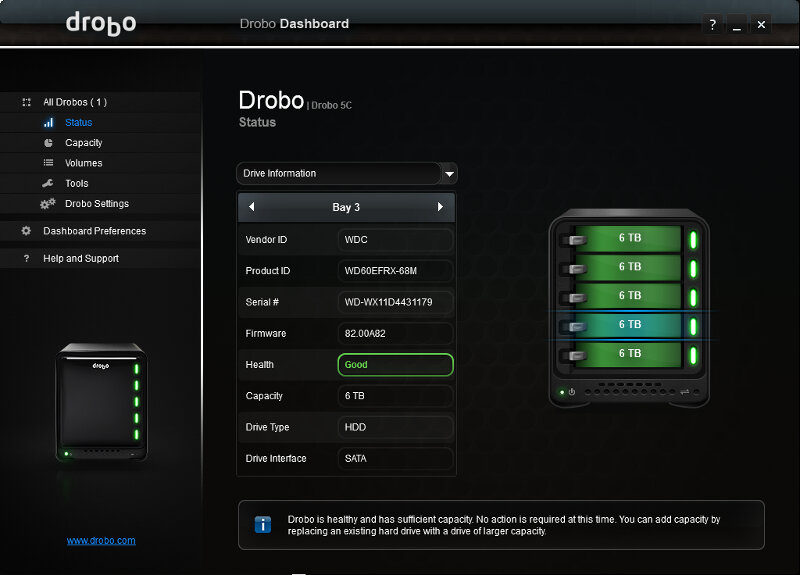
You can select drives directly from the shown image and get detailed information about the drives too. This includes the vendor, product, serial, firmware, and health, among other things. The only thing missing here would be a way to trigger the built-in SMART tests.
The performance status will show the current throughput of the system in both IOPS and MB/s.
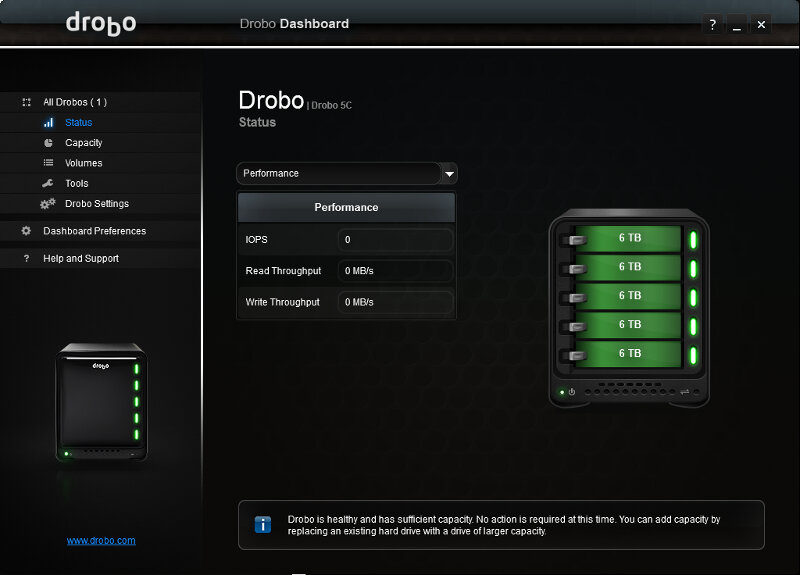
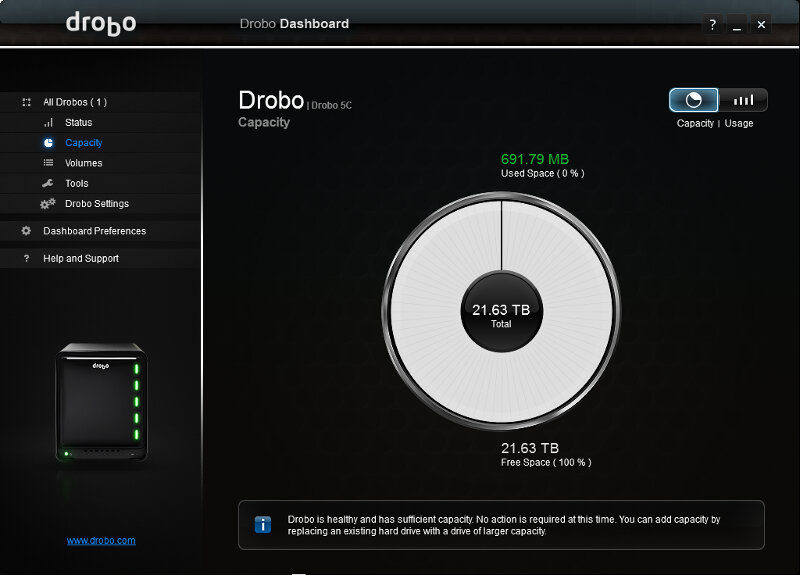
Moving on, we can take a look at the available capacity and how it’s being used. We can watch it as a pie chart like here for a great visual representation.
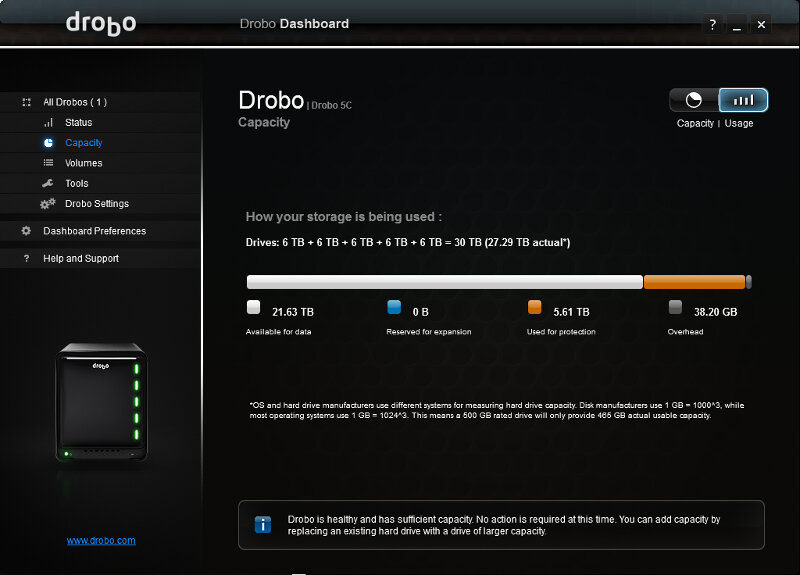
But we can also watch it as a coloured line graph.
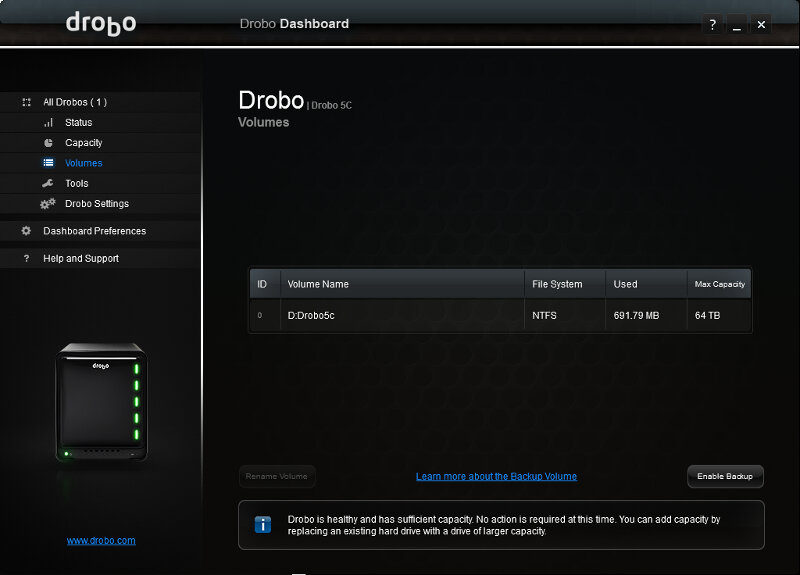
Next up are the volumes. We have our default volume, and we can also create a backup volume to be used for our system backups and Time Machine backups.
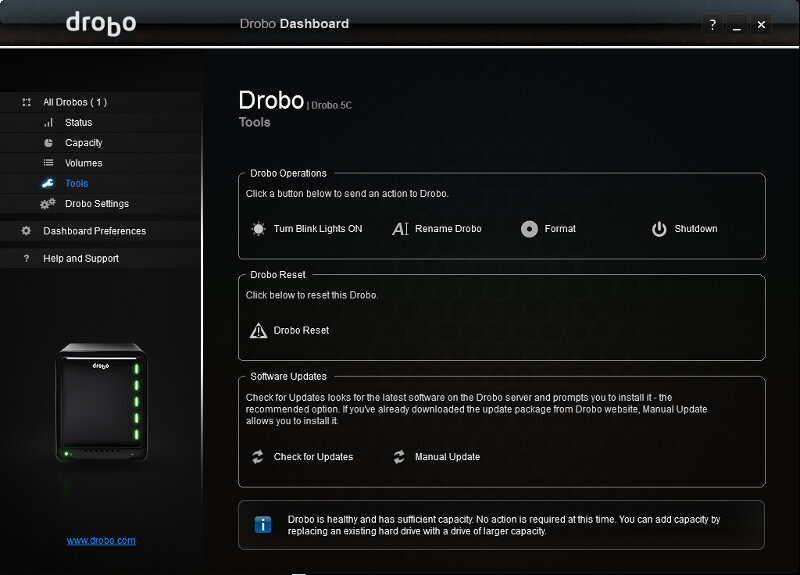
There aren’t any apps available such as there were on the Drobo 5n, but we still have a few tools and settings that we can adjust. We can change how the LEDs behave, rename the unit, format our drive or shut down the DAS. We can also reset it to factory settings and update the firmware.
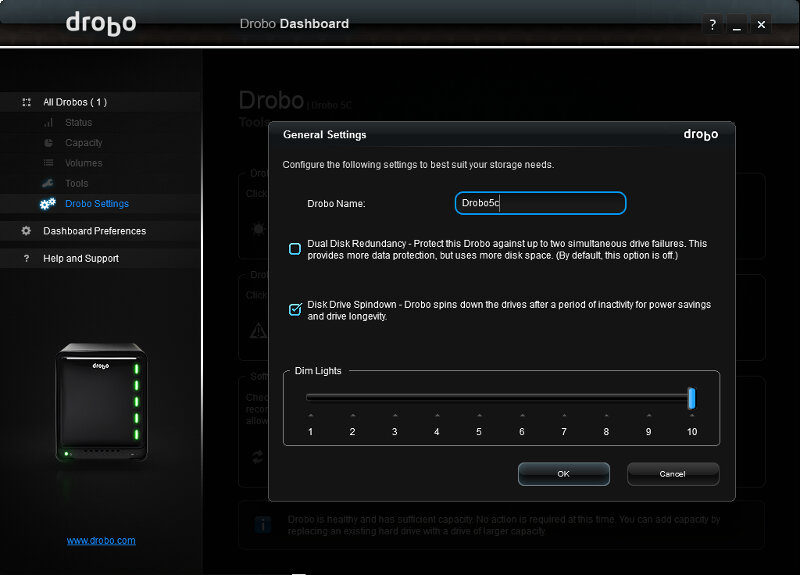
Within the settings, we can adjust whether we want a single or a dual disk redundancy. We can also set the drive to spin down on inactivity, which will be the preferred setting for most people. Last but not least, we can adjust the light intensity of the LEDs.
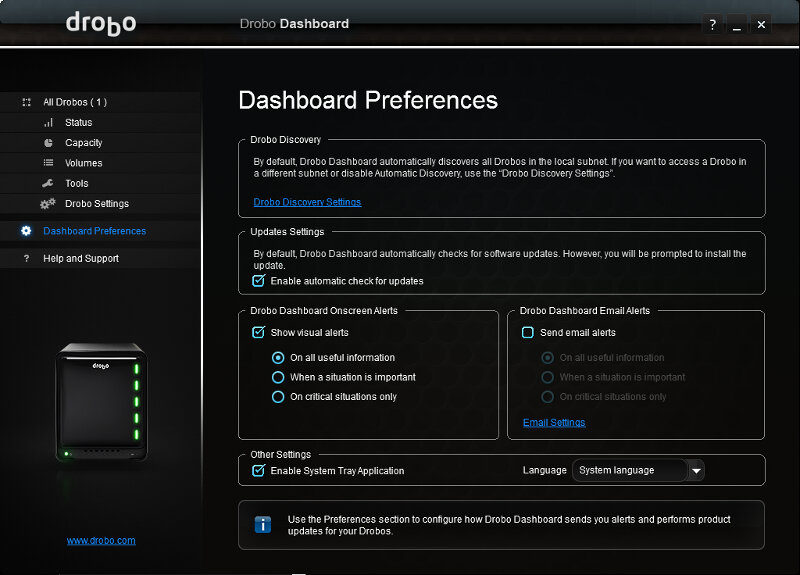
There are a few settings for the Dashboard itself too, starting with the discovery settings. You can have it check for updates automatically when you launch it and define the types of visual alerts. You can also have it send out email alerts.
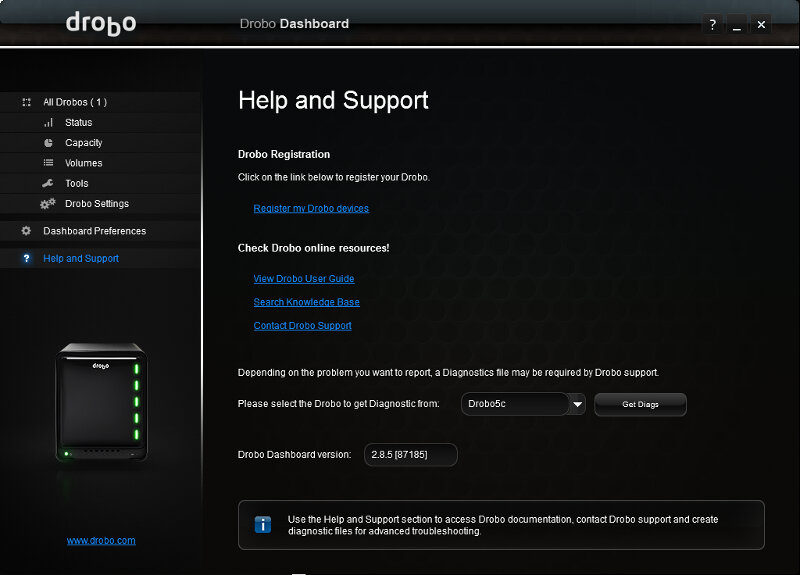
The last page is for help and support. From here you get links to vital resources along with the ability to download diagnosis logs from your Drobo units.
