Kingston DCP1000 1.6TB PCIe NVMe SSD Review
Bohs Hansen / 6 years ago
Testing & Methodology
In a bid to make our testing as thorough and as accurate as possible, we have devised a testing methodology that will give us the maximum amount of data. While this means that testing each drive will take considerably longer – easily up 36 hours – we gather an overall larger picture. It helps, both you as the reader and me as the reviewer, to gain a clearer view of the drive’s overall performance, strengths, and weaknesses. It also provides a more accurate analysis of how each drive performs under different conditions.
Today’s review is a little different than usual. Due to the software RAID setup, some benchmark apps won’t work in the usual manner. Adding them would bring confusion as the results aren’t accurate.
Drive Setup
For this review, I will test the drive with RAID 0, RAID 1, JBOD and Single modes. RAID 0 will give us the best performance and it’s the most likely setup scenario for a single DCP1000, but we’ll cover all.
Data Fillage
There are many ways to test a storage drive, and we have chosen to include close to every test possible. We will start with a typical benchmark analysis of the formatted drive with various village scenarios. However, depending on how a drive is built, the performance may differ depending on how much data it is already storing. Testing this, the drive will be tested empty as well as with 25%, 50%, and 75% space usage. For these tests, we will be using Anvil’s Storage Utilities, AS SSD Benchmark, ATTO Benchmark, and CrystalDiskMark.
Application and Gaming
Besides these synthetic fill tests, the drive is tested with PCMark 8’s storage benchmark to get real-world performance results.
The Preparation and In Between
The drive will be formatted as NTFS with default settings, as most users will do. The quick format option isn’t used as that might affect the performance the first time data is written.
Modern operating systems all take care of the TRIM command in the background and it isn’t something to worry about for regular users. However, for these reviews, I will add a waiting period between each benchmark to make sure that the TRIM command has been fully executed and finished. After all, we want a clear picture of the drive’s performance with minimal interference from the operating system.
On each page that follows with the benchmark results, I have inserted result screenshots from the benchmarks, created drive analysis chart for the fill-level performance, and added RAID mode comparison charts where possible.

Hardware
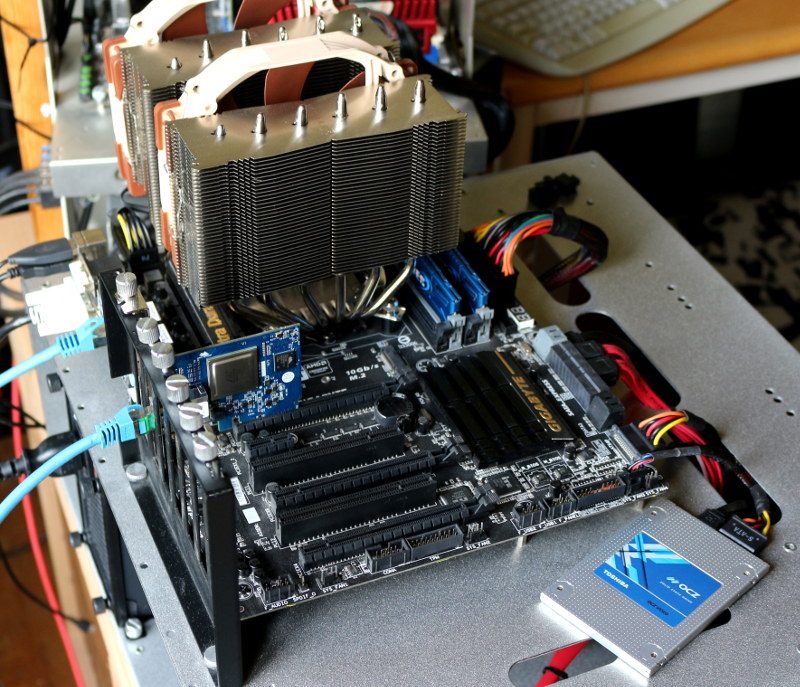
- Supermicro C7Z270-PG
- Intel Core i7-7700K
- Crucial Ballistix Sport DDR4 2400MHz (4x8GB)
- Toshiba OCZ VX500 512GB SSD
- be quiet! Dark Power Pro 11 (1200W)
- Noctua NH-D15S
- Cooler Master HAF XB EVO with Noctua NF-A14 FLX fans
Software
- Anvil’s Storage Utilities
- AS SSD Benchmark
- ATTO Benchmark
- CrystalDiskMark
- PCMark 8 Storage Benchmark
- Windows 10


