Microsoft Excel Turning Figures into Visuals
Peter Donnell / 9 years ago

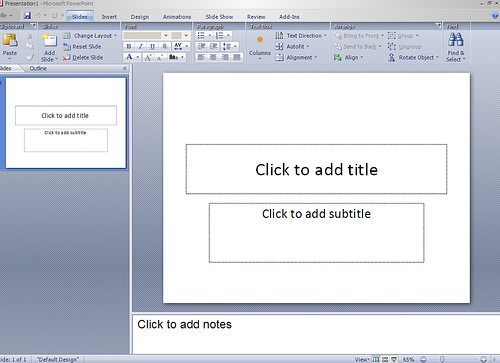
Anyone who has ever made a PowerPoint presentation will know that the old line about a picture being worth a thousand words is as true in 2015 as it has ever been. But whilst PowerPoint was cutting edge not so long ago, things have moved on. Information is communicated quicker, more effectively and more memorably if it is delivered directly in the right format and in the most relevant mode.
You could try singing your sales figures in the style of a song and dance star, but whilst it would undoubtedly be memorable as a performance, the chances are no-one would actually remember the figures – and in any event getting all the right people in the same room together takes precious time to organise and is incredibly inefficient.
Business information needs to be distributed to decision makers quickly and effectively. The time it takes to put together and set up a presentation can be the time it takes for the actual data at the core of that information to become outdated. Speed of delivery as well as clarity of presentation has never been more imperative.

Intelligent business dashboards
Recognising that imperative, leaders in the field of business information management Bilbeo are marketing a state of the art dashboard of key performance indicators that deliver close to real time data throughout a business. The benefits of the immediacy of information and the clarity of its exposition that Bilbeo’s dashboard deliver promise to free business managers from the reliance on slow, inefficient and often hard to analyse information streams.
As a solution that is malleable to every individual client’s requirements Bilbeo’s Intelligent Business Dashboard draws on the Excel spreadsheet data to present a detailed and ongoing picture of how each aspect of a business is performing. It allows managers to keep their finger on the pulse of all of the key performance indicators of their business on an hour by hour basis. Being able to access what is in effect live data cross all aspects of the business allows for more fully informed and more agile decision-making and hence better responses to changing circumstances.

Maximised transparency
The attractiveness of Bilbeo’s offering – as opposed to the generation of an in-house BI solution is that it entails the bare minimum of set up time. Translation of existing data to the dashboard by means of means of a unique data mining algorithm means it is immediately operable with none of the resource implications that bespoke solutions entail. And by turning figures into visuals it renders the information instantly accessible to everyone.
Because the dashboard brings business information to the surface so starkly it offers transparency right across an organization. All departments are able to see not only their own KPIs, but also those of others, thereby identifying bottlenecks as they form – rather than post hoc in terms of their effects – and driving ownership throughout the organization, fostering and maintaining shared organizational goals.
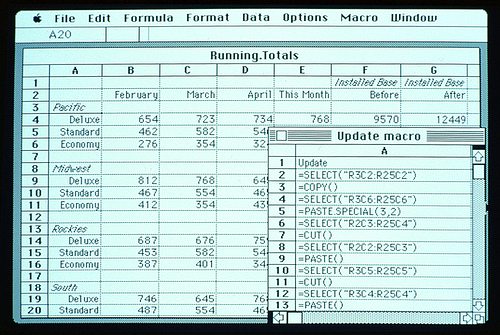
Running a business, and explaining how each component of it interrelates, will never be the same again. Monthly meetings with set piece PowerPoint presentations are in the process of being made redundant. Business Information technologies are increasingly distributing the information that was once delivered in those meetings as a real-time stream of readily accessible, easily readable information. In 21st century business there is simply no place for the old song and dance routine of reporting out of date numbers.


