Synology DiskStation Manager (DSM) 6.1 Review
Monitoring and Maintenance
There can be many reasons to keep an eye on your system’s performance and luckily, DSM has a great tool for this too with their Resource Monitor.
The Resource Monitor provides a complete overview of the utilisation of the device as well as detailed reports.

The CPU page shows current and average utilisation by the user, system, and the I/O wait time. Here I’m taxing the system hard with two torrent downloads at a combined speed of around 10 MB/s while copying a couple of GB photos and videos onto the NAS over my network. The NAS itself is processing the video files and photos and creating thumbnails too. That’s why we see such a load here and the DS216 does a great job and handling this simultaneous.

There’s a view of the memory in much the same way as for the CPU load. There’s a load-over-time graph that can be switched and a bar graph showing the various usage.

The network page shows sent and received speeds. We can also easily imagine how this page would look if we had multiple network connections such as those with multiple LAN ports have.

Disk and Volume can look the same, but they don’t have to. It fully depends on your setup and designation of them.

The graphs themselves are pretty self-explanatory here.

Besides the utilisation, we can have a look at the transfer rates too and separate read and write speeds. Moving the cursor over any of the graphs will also show the exact details for that moment in time.

Last but not least, you can have a look the IOPS performed. They won’t be spectacular in a 2-disk setup with HDDs, but that situation changes when you move up to the business sector and utilise NAS with 16+ bays, extension enclosures, and SSD cache.

In the case that you should run into bottlenecks along the way and want to narrow down what is taking up the system’s resources, then it’s the processes page that you’ll want to look at. You can sort by the listview headers and that way quickly find what is taking up memory or CPU load.

This is also the place to check up on connected users. The Resource Monitor will show the origin, connection type, and service accessed along with the username and time.

The settings page for the Resource Monitor doesn’t have a lot of settings, but we can change the real-time monitoring duration. The default setting is 15 minutes and that should be sufficient in most cases – but not all. You can increase this to 30 mins, 60 mins, or 120 mins.

Firmware Update
Having the latest firmware installed can bring a lot of new features such as DSM 6.1 does this time, and it also fixes possible bugs and vulnerabilities. You can manually upload a firmware file, such as I did to perform this review with the RC version (Release Candidate).

The update settings allow you to set when you what to be notified and how the system should handle possible new updates. You can specify the time when the NAS should check and whether it should look for all updates or just the important ones. They can be installed automatically too or downloaded to be installed when it is convenient for you.

Notifications
The notification feature is a great way to keep track of your system, even when you aren’t near it. The simplest function is the email service that will send notifications to the entered email address in the event of status changes or errors.

The SMS service requires an SMS provider and appropriate setup. This is mostly for business users.

Push notifications for your mobile devices are available too. Devices that have been paired with the NAS through their Synology companion apps can be managed fro here and they can also be sent through Synology’s email server.

Within the advanced panel, you can select which events go out via which service. In the case of the SMS feature you’ll want to limit it to the most important ones as it most likely will cost you a fee every time you send an SMS.

Logging System
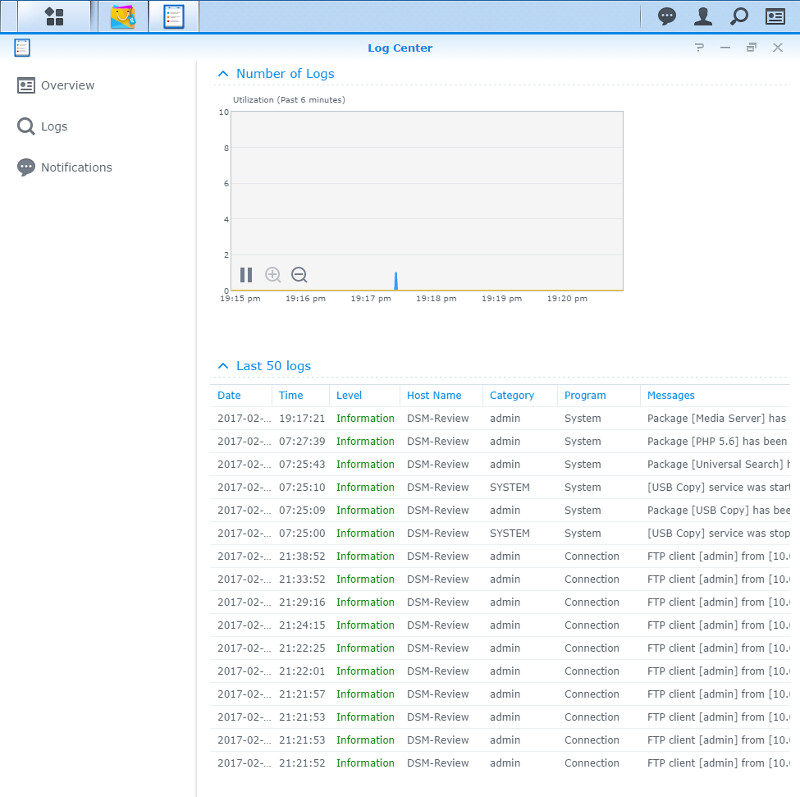
Synology’s DSM has a simple Log Center built right into DSM and it is available right away, but you can expand it further through an app installation. The basic feature has a simple overview with a graph on the last 50 log entries.

The log list itself can be fully cleared and also exported in both HTML and CSV format.

The last page in the basic version of the Log Center is for the notification rules.

Within the Package Center, you’ll find the advanced Log Center. Installing this will add a list of new features to the function.

Now we can store archives of our logs to a shared folder and set limits to the log size and formats.

The logs can also be sent to Log servers for central management.

Or you can use your DSM-powered Synology NAS as Log Center for other systems.

Overall, a feature for every contingency.


