Toshiba AL14SX 15000RPM SAS eHDD RAID Review
Bohs Hansen / 7 years ago
Test Setup & Methodology
Data Fillage
There are many ways to test a storage drive, and we have chosen to include a broad spectrum in order to cover as many situations as possible. We will start with a typical benchmark analysis of the formatted drive with various fillage scenarios. A mechanical drive will have to move its read-heads over the surface to reach the data location, and that has a natural impact on the performance. To see the impact it might have, the drive will be tested empty as well as with 25%, 50%, and 75% space usage. For these tests, we will be using Anvil’s Storage Utilities, AS SSD Benchmark, ATTO Benchmark, and CrystalDiskMark.
Plain Drive Performance
Following the fillage tests, the partition gets removed, and we check the drive’s raw performance. These tests will determine the hardware’s capabilities while eliminating any interference from the set file system. AIDA64’s storage benchmark and IOmeter are both great tools for this, and they help us paint an even clearer picture of the drive. The IOmeter tests I run are quite different from the rest as they will give a final result after a longer performance test rather than a maximum or average score; this gives us yet another view of the tested drive over the regular tests.
Controller Setup
For all storage drive reviews, I’ll make sure to disable the controller’s performance-enhancing features. We are testing the drives and not the controller. As such, it is important not to get skewed results by write caching or read-ahead. Those two controller features can increase your drive performance immensely, so make sure you do enable them when performance matters.

Hardware
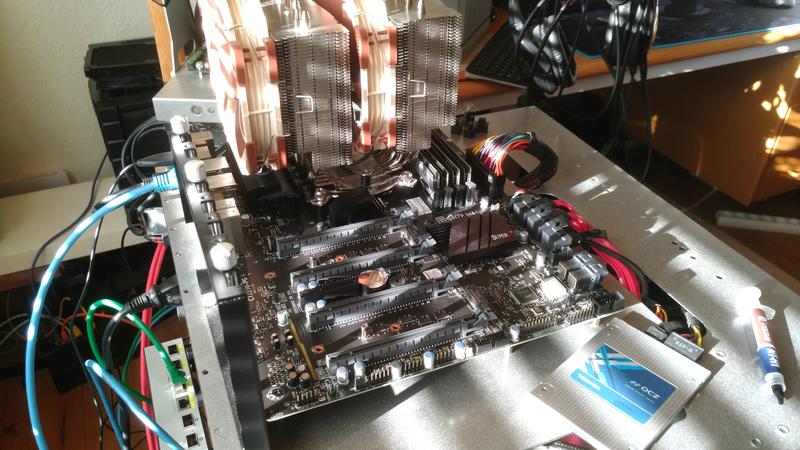
- Supermicro C7Z270-PG
- Intel Core i7-7700K Processor
- Crucial Ballistix Sport DDR4 2400MHz (4x8GB)
- Toshiba OCZ VX500 512GB SSD
- be quiet! Dark Power Pro 11 (1200W)
- Noctua NH-D15S
- LSI MegaRAID SAS 9271-8i
Software used:
- AIDA64 Storage Benchmark
- Anvil’s Storage Utilities
- AS SSD Benchmark
- ATTO Disk Benchmark
- CrystalDiskMark
- IOMeter
- Windows 10 Pro


